
AI Session Replay Found the Funnel Leak: A Cleaner Legal Layout Showed a 25% Higher Opt-In Rate
The Short Version
REVV Travel had traffic reaching its motorcycle-tour application page, but too many visitors disappeared before becoming identifiable leads. Funnel analytics showed the loss. They did not explain it.
So we ran an AI-assisted session-replay review. The replay audit rendered 213 playable sessions from a 48-hour window and grouped each visit by what was visible when the visitor stopped. Fifty-six sessions ended without an identity being captured. In 43 of those 56, the last visible screen was the opening email step, and the median session lasted only three seconds.
Human review of those endings turned the pattern into a testable hypothesis: the legal language was visually overpowering the page. The disclosure block consumed the experience, made the form feel secondary, and gave a new visitor too much to process before the first small action.
We kept the disclosure accessible but restored the hierarchy: offer first, form first, legal detail second.
In the 50/50 split-test snapshot shown below, the cleaner experience produced 104 opt-ins from 1,037 page views (10.03%). The legal-heavy experience produced 87 from 1,088 (8.00%). That is a 2.03-percentage-point gap, a 25.4% higher observed opt-in rate, or about 20 additional opt-ins per 1,000 visits.
The important word is observed. The test was still running, and this snapshot measured opt-ins—not qualified applications, calls, or sales. AI found a plausible leak. Human review made it a hypothesis. The split test measured the response.
Analytics Told Us Where People Left. Replay Told Us What They Saw.
A funnel report is good at answering where:
- how many people reached the page;
- how many started the form;
- how many became leads; and
- which step held the largest drop-off.
It is much weaker at answering why.
A visitor who leaves after three seconds could dislike the offer, distrust the brand, miss the form, hit a broken element, see a validation error, or simply get distracted. In a standard event report, all of those sessions can collapse into the same line: no conversion.
Session replay preserves the missing context. Instead of counting only the last click, the review reconstructs the page, seeks to the visitor's final interaction, reads the visible question and error state, and groups similar endings together.
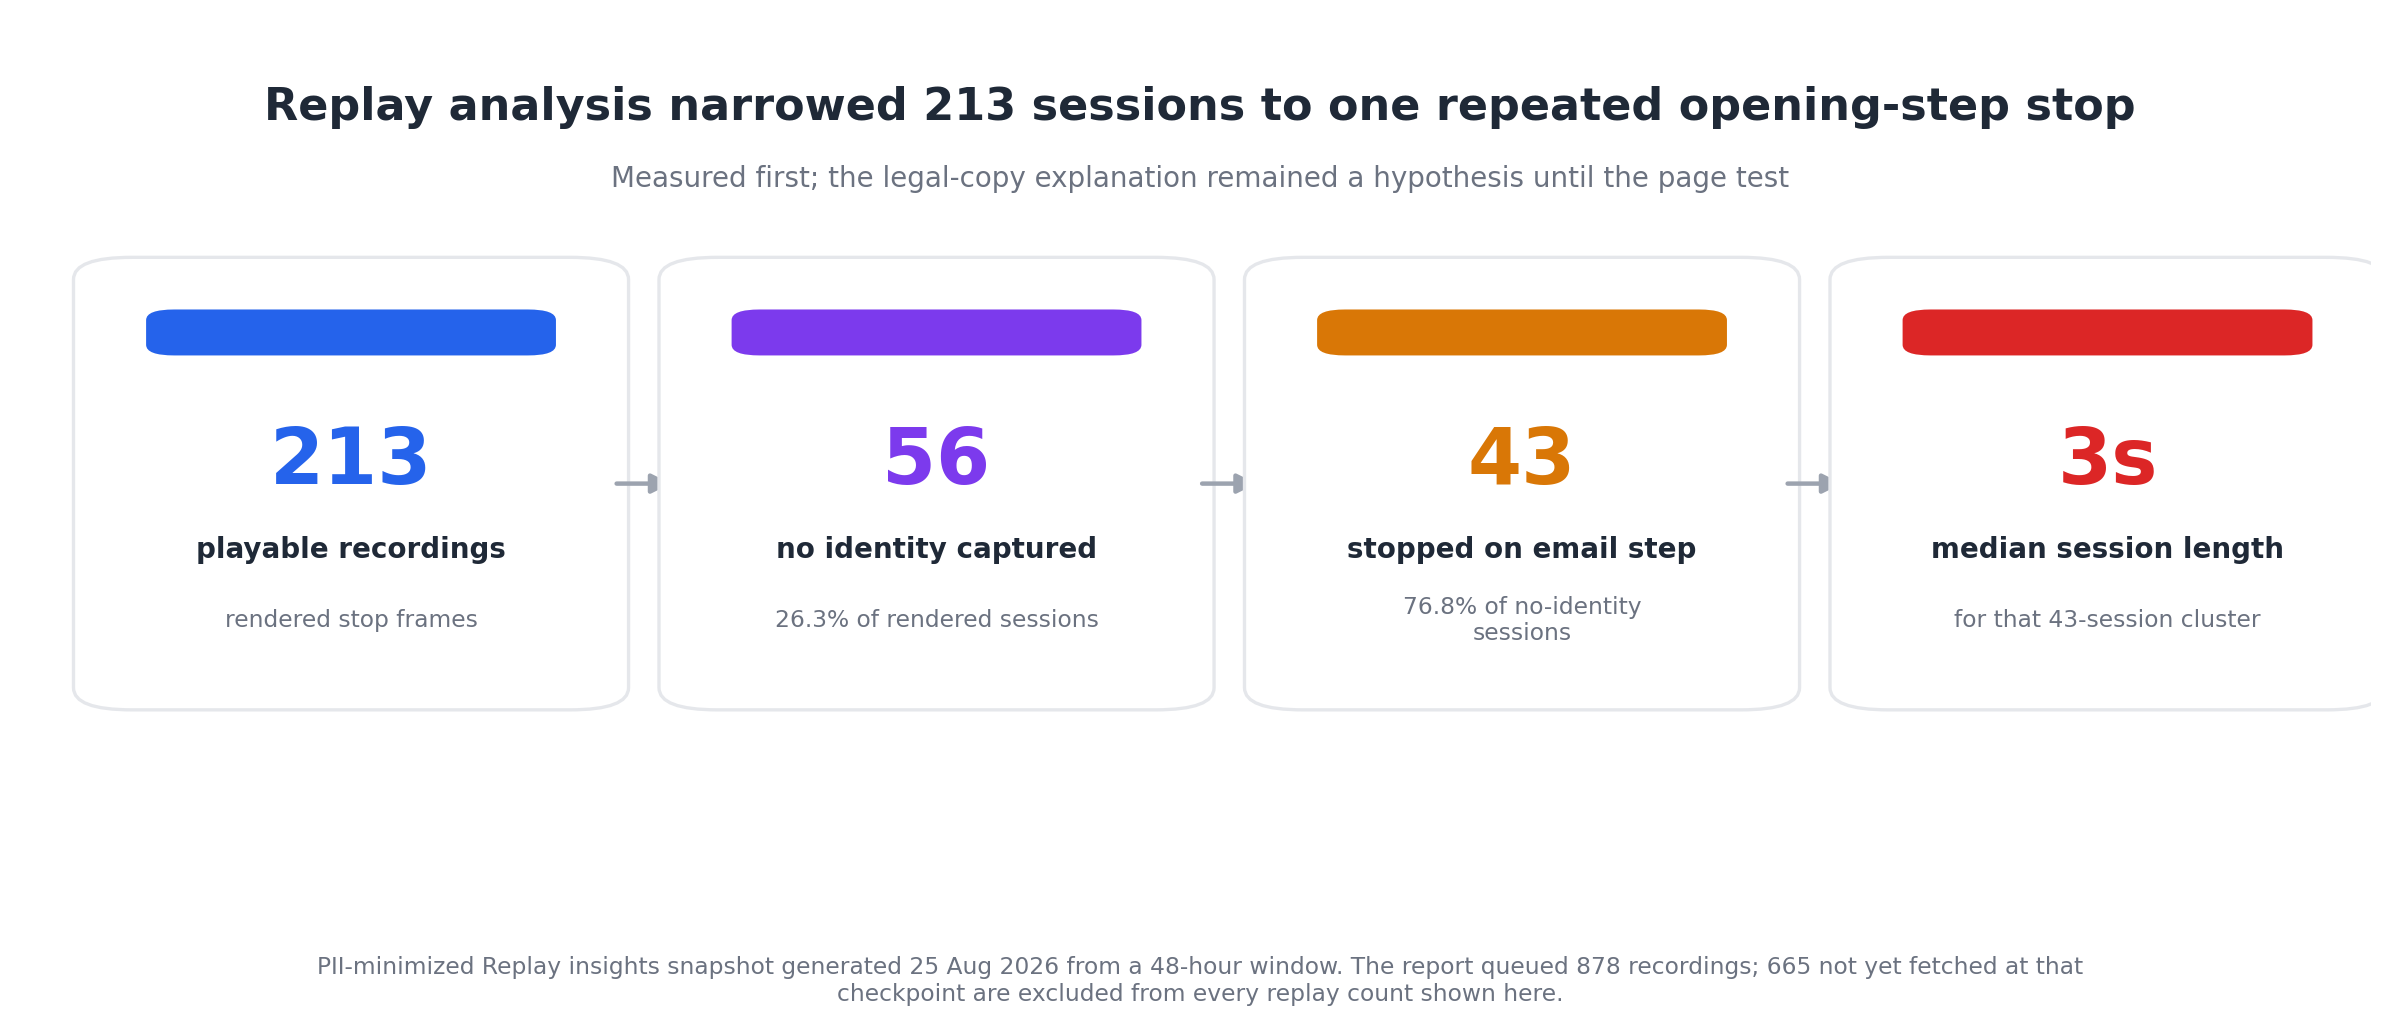
The measured replay pattern: 56 of 213 rendered sessions ended with no identity captured; 43 of those stopped on the opening email step after a median of three seconds.
That did not prove the legal block caused the exit. It did something more useful at this stage: it told us exactly which sessions deserved human attention.
What the AI Did—and What It Did Not Do
“AI analyzed the recordings” can sound as if a model watched a wall of video and announced the answer. Our process was more disciplined:
- The replay workflow reconstructed the real screen. It rendered the point where each visitor stopped, including the visible form step, copy, filled state, and validation message.
- The analysis grouped recurring outcomes. Captured leads, partial records, visitors who typed but never became leads, and visitors who never typed were kept separate.
- AI summarized the clusters. That converted hundreds of individual timelines into a short list of repeated stopping points worth reviewing.
- A human checked representative sessions. We compared the summary with the actual rendered experience before deciding what the pattern might mean.
- The page test—not the AI—measured the effect. The replay analysis generated the hypothesis; the traffic split supplied the result.
This division matters. AI is excellent at compressing repetitive evidence and making patterns reviewable. It should not be allowed to turn correlation into causation by itself.
The report had queued 878 recordings in the 48-hour window. At the saved checkpoint, 213 had rendered and 665 had not yet been fetched from the recording provider. Every replay claim in this article uses only the 213 rendered sessions. The split-test result uses its own, larger page-view counts.
The Page Looked Like a Legal Document With a Form Inside It
The disclosure was not unnecessary. The hierarchy was the problem.
On the legal-heavy experience, dense terms occupied so much visual weight that the form stopped feeling like the obvious next action. A visitor arriving from an ad had to resolve the offer, the form, and a wall of conditions at the same time.
The recordings suggested that many visitors were not carefully reading the terms and rejecting a clause. They were leaving before giving the first field a real chance. A three-second median stop on the opening email screen is too short to support a story about considered legal objections. It is consistent with immediate visual friction—but that interpretation still needed a test.
The design question became simple:
Can we preserve the required disclosure without making it the loudest element on the page?
The cleaner experience restored one clear sequence:
- Understand the offer.
- See the first form action.
- Know that submitting carries terms and privacy implications.
- Open or read the full legal detail when needed.
The goal was not to hide consent or remove protection. It was to stop asking legal copy to do the job of a headline, a form label, and a call to action simultaneously. Any change to required disclosures should still be reviewed by the business's legal counsel.
The 50/50 Test: 10.03% Versus 8.00%
The page entered a 50/50 traffic split on 24 August 2026. At the captured checkpoint:
Experience | Page views | Opt-ins | Opt-in rate |
|---|---|---|---|
Cleaner, form-first experience (control) | 1,037 | 104 | 10.03% |
Legal-heavy experience (variation) | 1,088 | 87 | 8.00% |
Total | 2,125 | 191 | 8.99% blended |
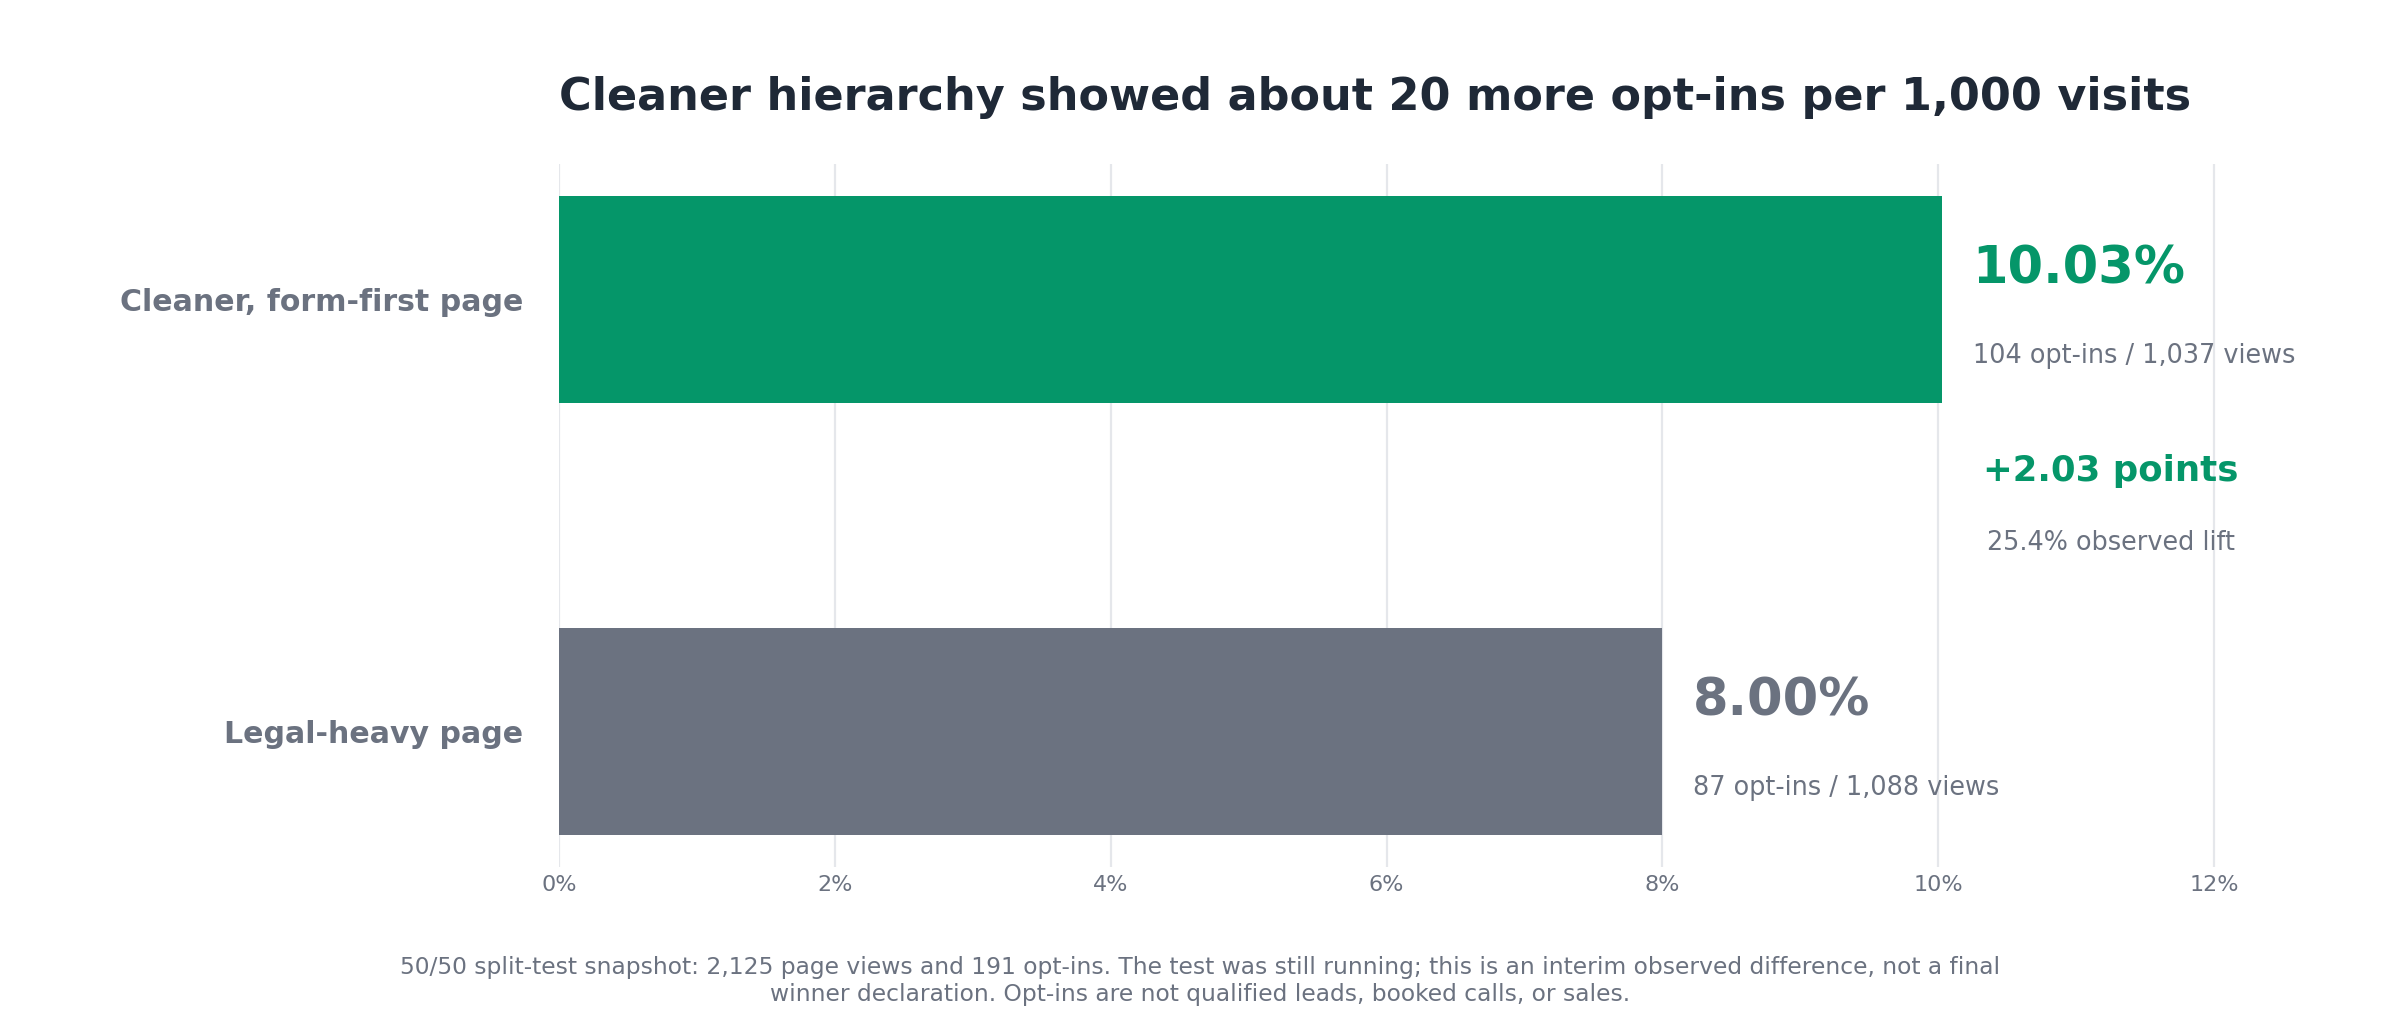
Across 2,125 page views, the cleaner page showed a 2.03-point advantage—about 20 additional opt-ins per 1,000 visits.
Here is why the same result can appear as either “20%” or “25%”:
- The legal-heavy rate was 20.2% lower than the cleaner rate:
1 − (8.00 ÷ 10.03). - The cleaner rate was 25.4% higher than the legal-heavy rate:
(10.03 ÷ 8.00) − 1. - The absolute difference was 2.03 percentage points.
- At 1,000 visits, that difference is about 20 extra opt-ins.
For a result headline, we prefer the last two descriptions. They are easier to understand and do not hide the denominator.
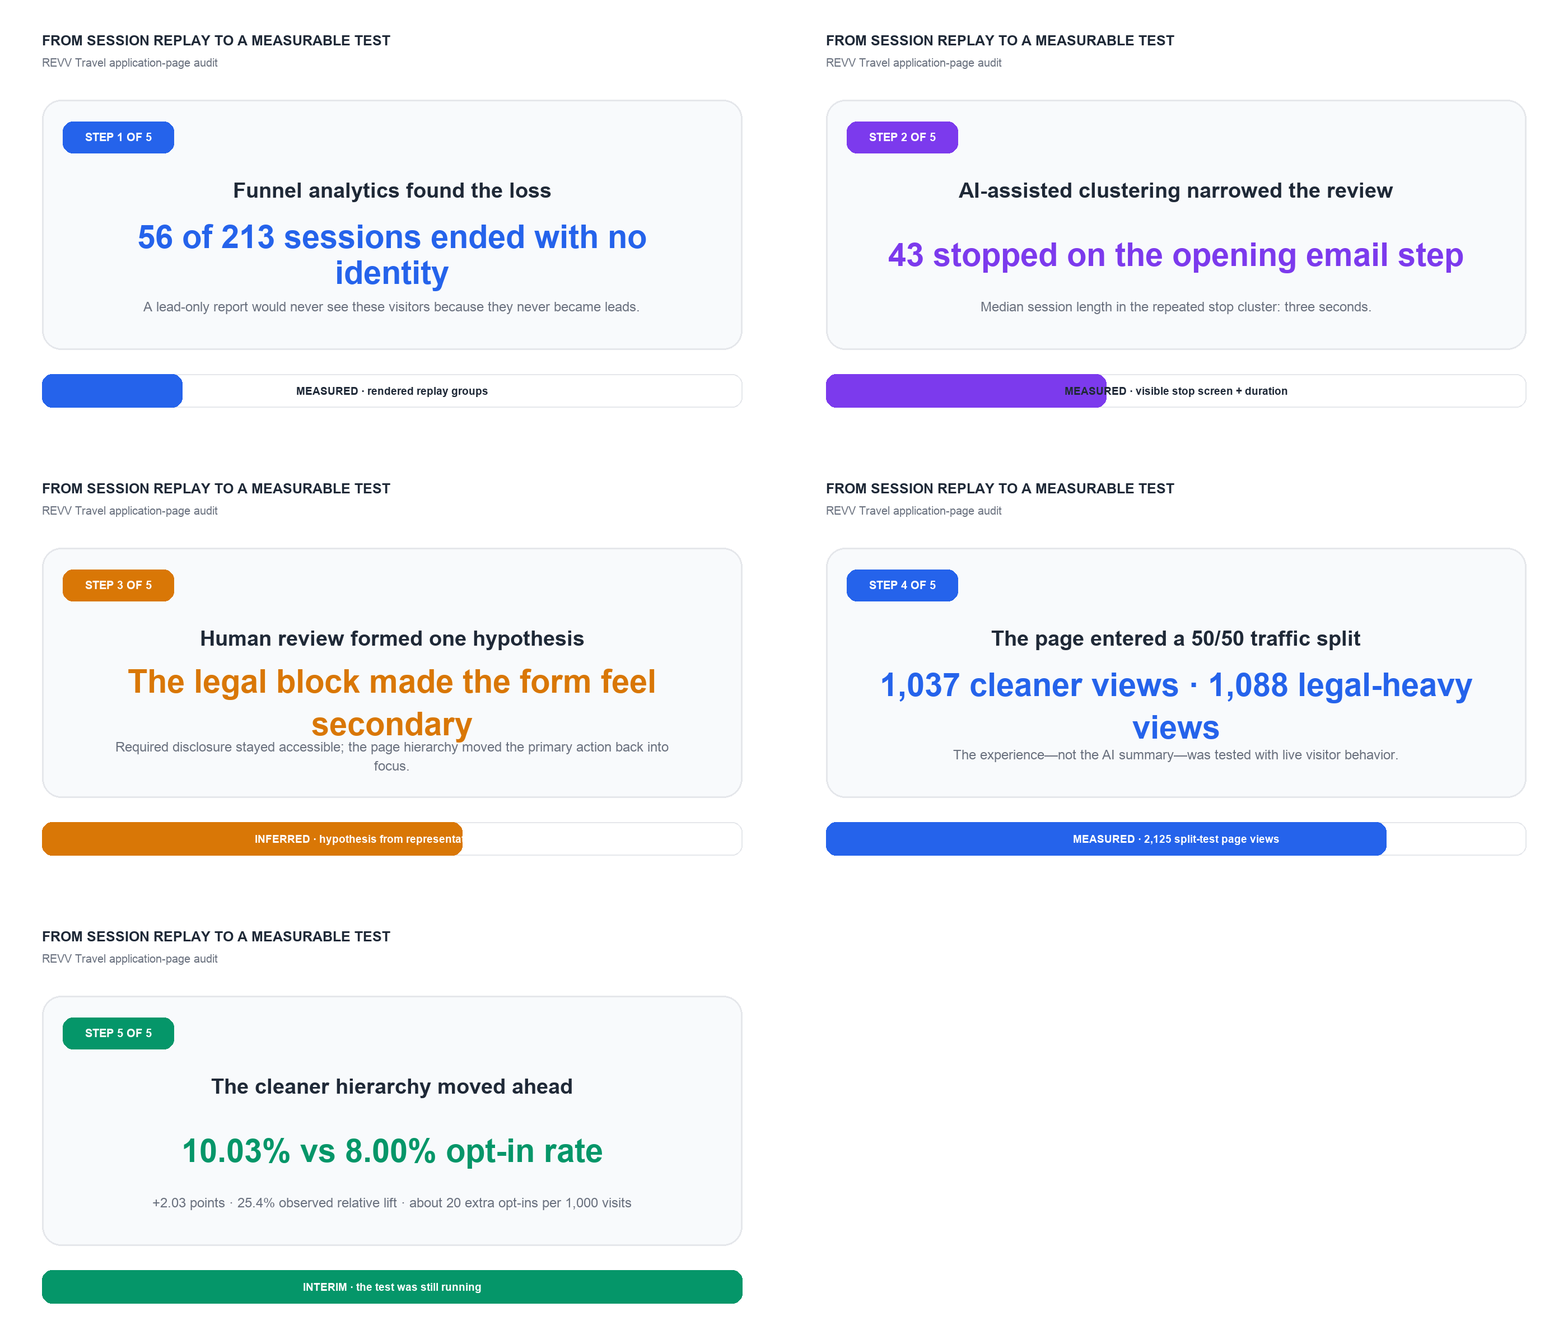
Where → why → test → result. AI shortened the path from hundreds of recordings to one measurable page hypothesis.
The Honest Part: This Was an Interim Lift, Not a Final Verdict
The screenshot says the split test is still running. With 2,125 total page views, the cleaner page is ahead, but the difference had not crossed a conventional 95% statistical-confidence threshold at that checkpoint. A standard two-sided comparison gives a p-value of about 0.10.
That does not make the result meaningless. It defines how strongly we should speak:
- Supported: the cleaner page showed a 10.03% observed opt-in rate versus 8.00% for the legal-heavy page.
- Supported: the gap equals 2.03 percentage points, 25.4% relative uplift, or roughly 20 more opt-ins per 1,000 visits.
- Not supported yet: the cleaner page is a guaranteed permanent winner.
- Not measured here: qualified-lead rate, booked-call rate, or sales rate. Those rows were blank in the split-test report.
The layouts also differ in their overall visual treatment. The test supports a conclusion about the cleaner, form-first experience as a package. It does not isolate one sentence or one CSS property as the sole cause.
That distinction makes the case study more useful. The correct next step is to keep the test running to a pre-agreed stopping point, then verify whether the additional opt-ins survive the same downstream gates used in our REVV lead-quality review: completed application, qualification, booked call, and deposit.
The Repeatable Playbook
This is the workflow we would use on any lead-generation page:
1. Find the largest measurable loss
Start with page views, identified leads, completed applications, and booked calls. Do not begin by watching random replays.
2. Separate visitors by outcome
Keep completed leads, partial forms, people who typed without becoming leads, and people who never typed in different groups. The last group often never appears in a CRM at all.
3. Let AI compress the recordings
Group endings by the visible screen, final action, time on page, filled state, and error state. Ask for patterns, not a redesign.
4. Inspect representative sessions yourself
Open examples from the largest cluster. Confirm what was actually on screen. Static validation text, layout prominence, and a form pushed out of focus may produce no useful click event.
5. Write one falsifiable hypothesis
Ours was: the legal-heavy hierarchy makes the first form action less obvious; restoring form-first hierarchy should increase opt-ins.
6. Test the experience with real traffic
Split traffic, keep the offer and form intent aligned, record the page-view and opt-in denominators, and choose the stopping rule before reading the result.
7. Follow the extra opt-ins downstream
More form starts are useful only if they become completed, qualified leads. Compare booked-call and sales outcomes before scaling the winner.
How SimpleCheck Bakes This In
The first three articles in this series repaired REVV's Meta signal, followed the new applications into the CRM, and checked whether those leads booked and bought. This article adds the missing layer between the ad click and the lead: what the visitor actually experienced before disappearing.
Funnel Tracker keeps first-party visits, sessions, UTMs, click IDs, captured leads, and the recording attached to the same journey. Its Replay insights view separates no-identity sessions from captured and submitted leads, identifies the largest observed stop, and surfaces visible validation errors for review.
For the rest of the chain:
- Read the original four-day pixel rescue to see why clean conversion signals came first.
- Read the 15-day follow-up to see why an early conversion spike still needs time to mature.
- Read the sales and lead-quality review to see why cheaper opt-ins must still pass commercial gates.
Scope matters: Funnel Tracker is first-party journey tracking, lead matching, and session replay. It is not legal advice, call tracking, or a revenue ledger. The page's disclosure treatment remains the business's responsibility; the replay evidence tells you where to investigate and the experiment tells you whether the new experience performs differently.
Next Step
Take the largest drop-off on your own funnel and review 50 sessions from that exact outcome group. For each one, write down only three things: the last screen visible, whether the visitor interacted, and how long the visit lasted.
If one screen keeps repeating, do not redesign the whole funnel. Write one hypothesis, change the hierarchy, and split-test it.
Open Funnel Tracker in the portal—or message support from the portal chat with the page, date range, and outcome group you want reviewed. We will help you turn the recordings into a test instead of a highlight reel.
Updated on: 01/09/2026
Thank you!